Reconstruction with UFO
UFO is a general-purpose image processing framework developed at the Karlsruhe Institute of Technology and uses OpenCL to execute processing tasks on multiple accelerator devices such as NVIDIA and AMD GPUs, AMD and Intel CPUs as well as Intel Xeon Phi cards.
Here is an example on how to use TomoPy with UFO and its accompanying reconstruction algorithms.
Install
TomoPy,
ufo-core and
ufo-filters. Make sure to
install the Python Numpy interfaces in the python subdirectory of ufo-core.
DXchange is installed with tomopy to provide support for tomographic data loading. Various data format from all major synchrotron facilities are supported.
import dxchange
matplotlib allows us to plot the result in this notebook.
import matplotlib.pyplot as plt
Set the path to the micro-CT dataset and the sinogram range to reconstruct.
fname = 'tooth.h5'
start, end = (0, 2)
This dataset file format follows the APS beamline 2-BM and 32-ID definition. Other file format readers are available at DXchange.
proj, flat, dark, theta = dxchange.read_aps_32id(fname, sino=(start, end))
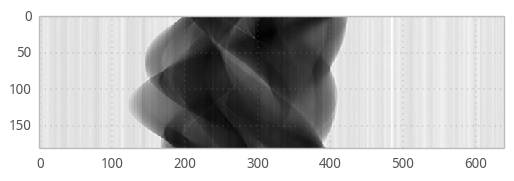
Plot the sinogram:
plt.imshow(proj[:, 0, :], cmap='Greys_r')
plt.show()
If the angular information is not available from the raw data you need to set the data collection angles. In this case theta is set as equally spaced between 0-180 degrees.
if (theta is None):
    theta = tomopy.angles(proj.shape[0])
else:
    pass
Perform the flat-field correction of raw data:
proj = tomopy.normalize(proj, flat, dark)
Tomopy provides various methods to find rotation center.
center = tomopy.find_center(proj, theta, init=290, ind=0, tol=0.5)
Calculate
proj = tomopy.minus_log(proj)
Now, reconstruct using UFO’s filtered backprojection algorithm. Note,
that we must set ncore to 1 in order to let UFO do the
multi-threading. If left to the default value or set to a value other
than 1 will crash the reconstruction.
recon = tomopy.recon(proj, theta, center=center, algorithm=ufo_fbp, ncore=1)
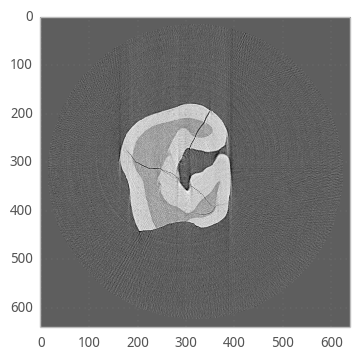
Mask each reconstructed slice with a circle.
recon = tomopy.circ_mask(recon, axis=0, ratio=0.95)
plt.imshow(recon[0, :,:], cmap='Greys_r')
plt.show()